Conflict Tracker
Bangsamoro map showing the conflict incidents tracked by Conflict Alert from 2011 to 2019.
Our Methodology
- 1 Data Gathering
- 2 Data Sorting & Encoding
- 3 Data Validation
- 4 Data Analysis & Visualization
- 5 Data Dissemination
Data Gathering
Our process starts by gathering data from reputable sources. Details about the conflict incident would be recorded such as persons involved, location, and other relevant information with safety and privacy in mind.
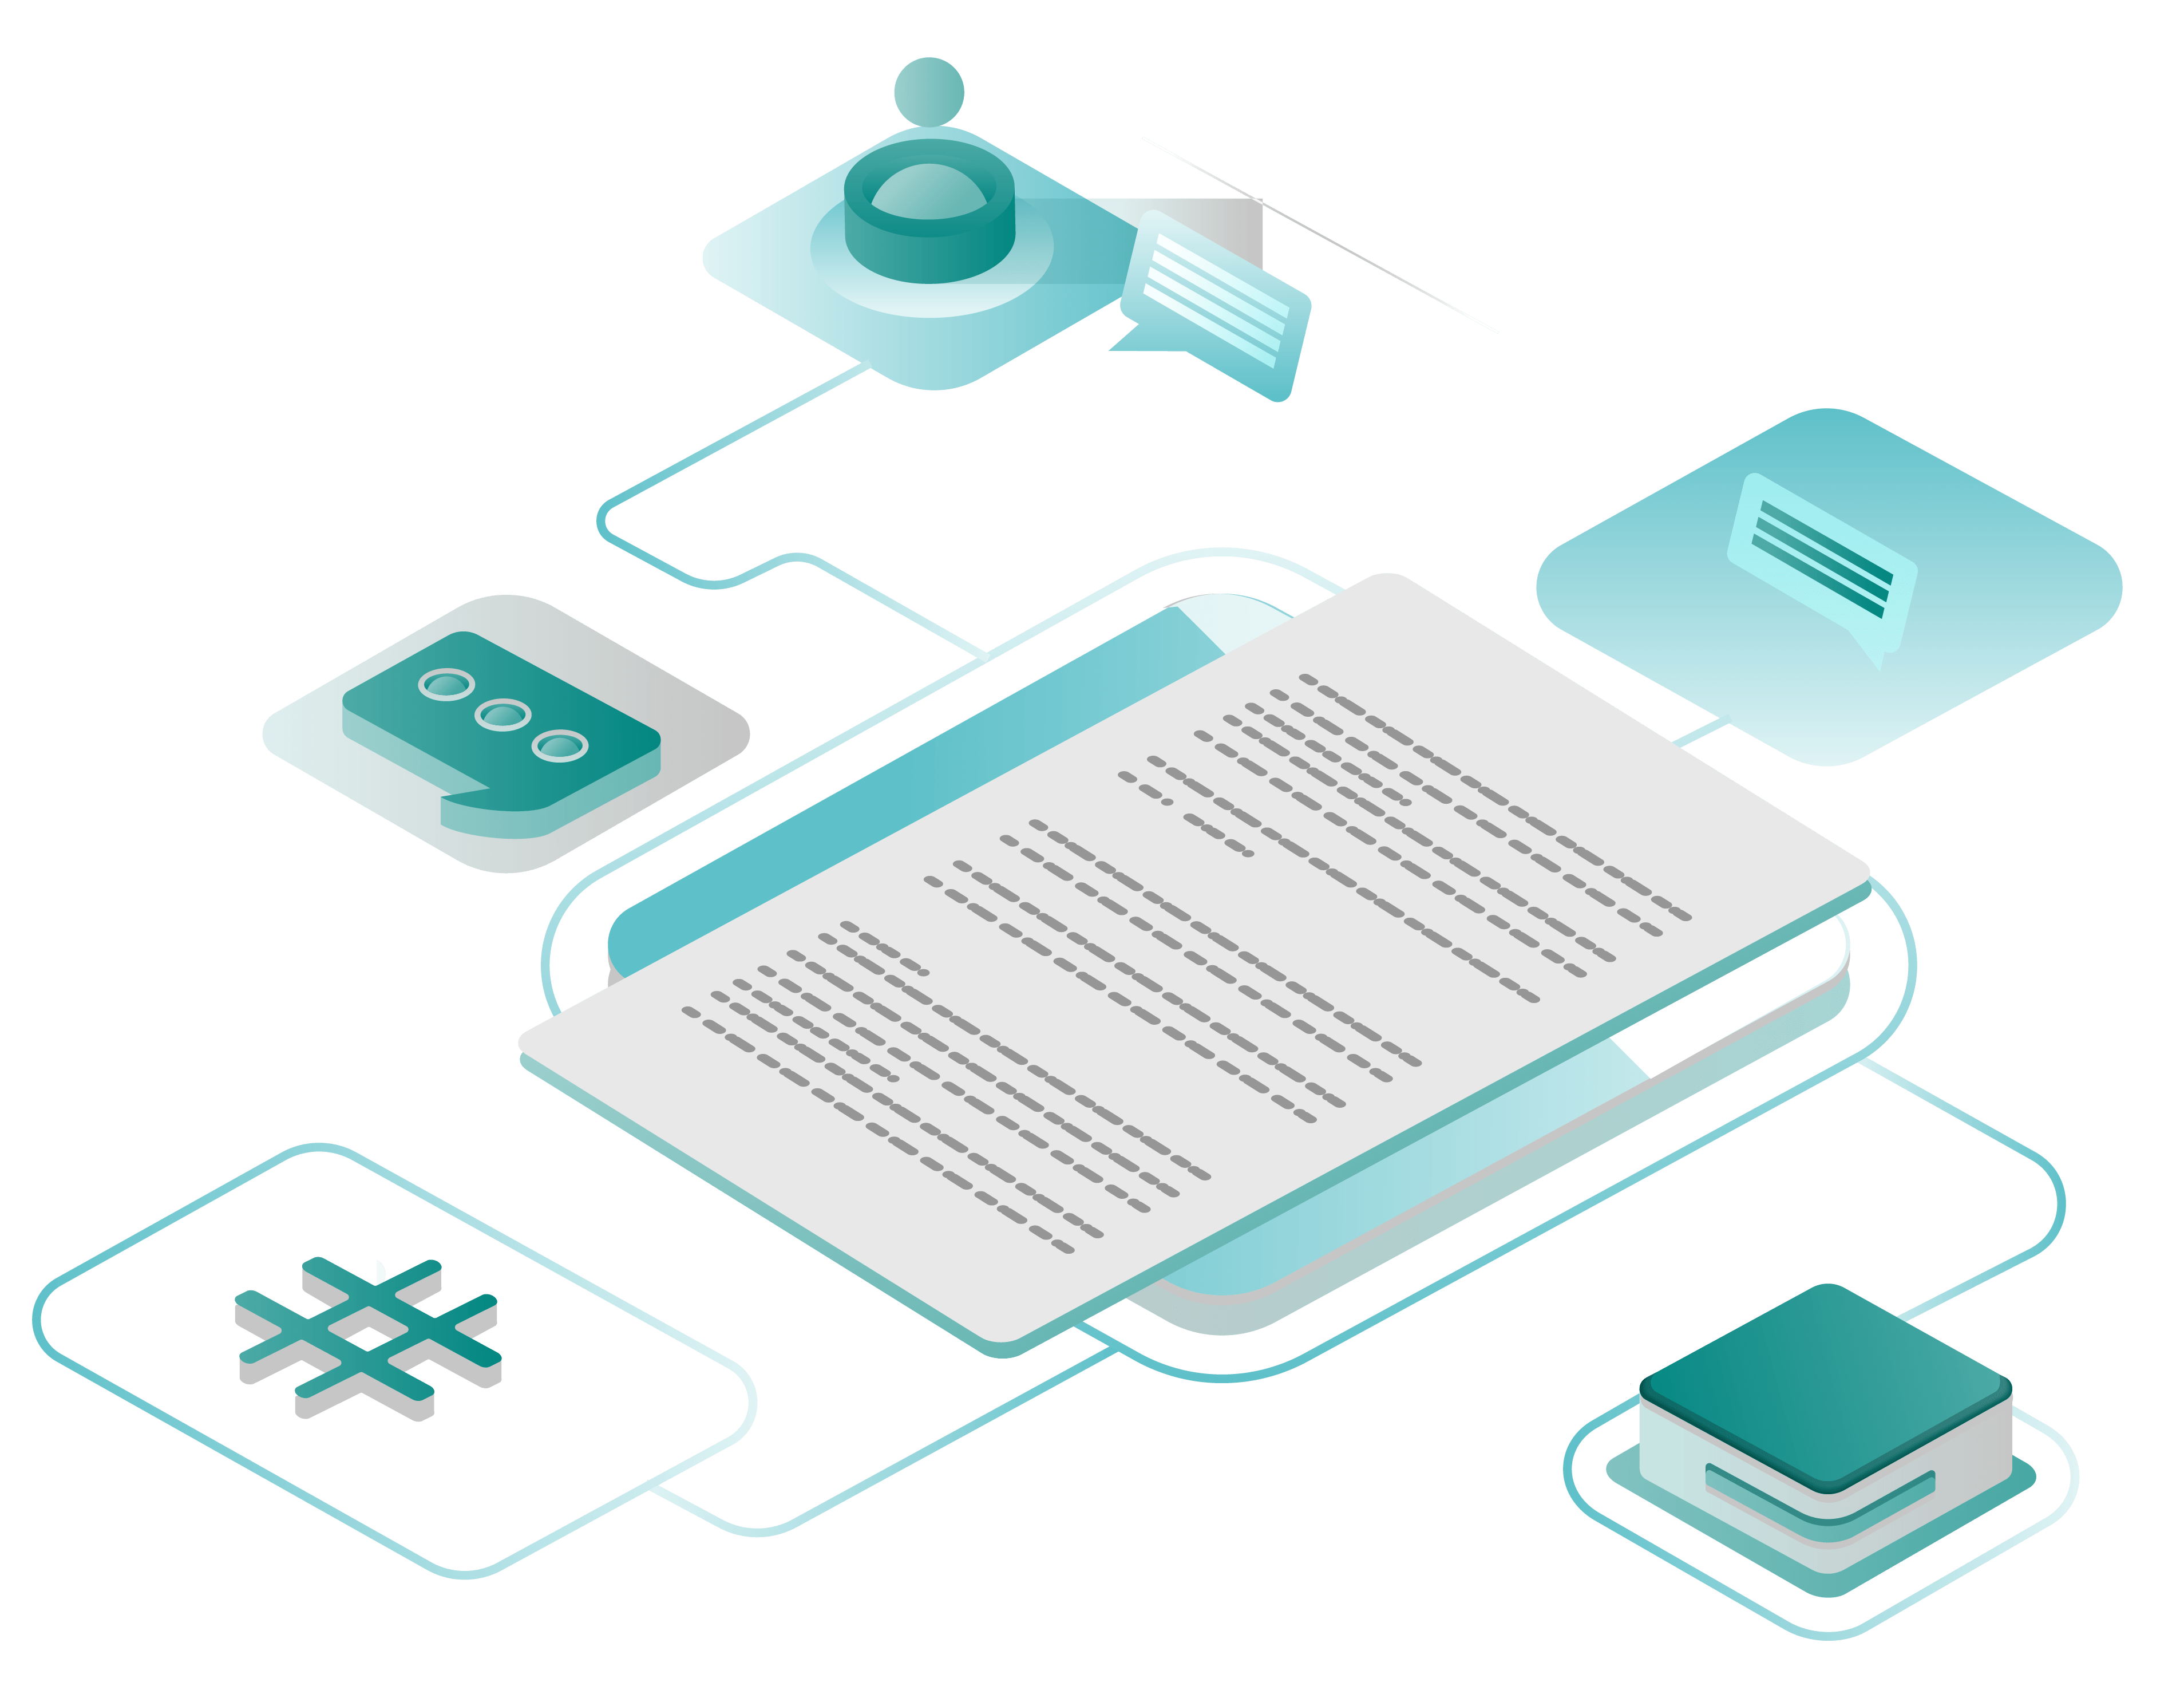
To ensure quality and accuracy of information, incident reports are harvested from police blotters in the BARMM, Caraga, and Davao region, as well as fifteen (15) local and national news outlets. Since police reports only cover the basic details, and most of the media only publish sensational news, it is important to collect data from multiple sources to ensure that every conflict incident will be considered for further analysis. After all, every conflict incident is a valuable data point in conflict research and peacebuilding development.
Data Sorting & Encoding
Incidents are sorted based on conflict categorization and details are encoded by a team of data encoders and reviewers to ensure accuracy.
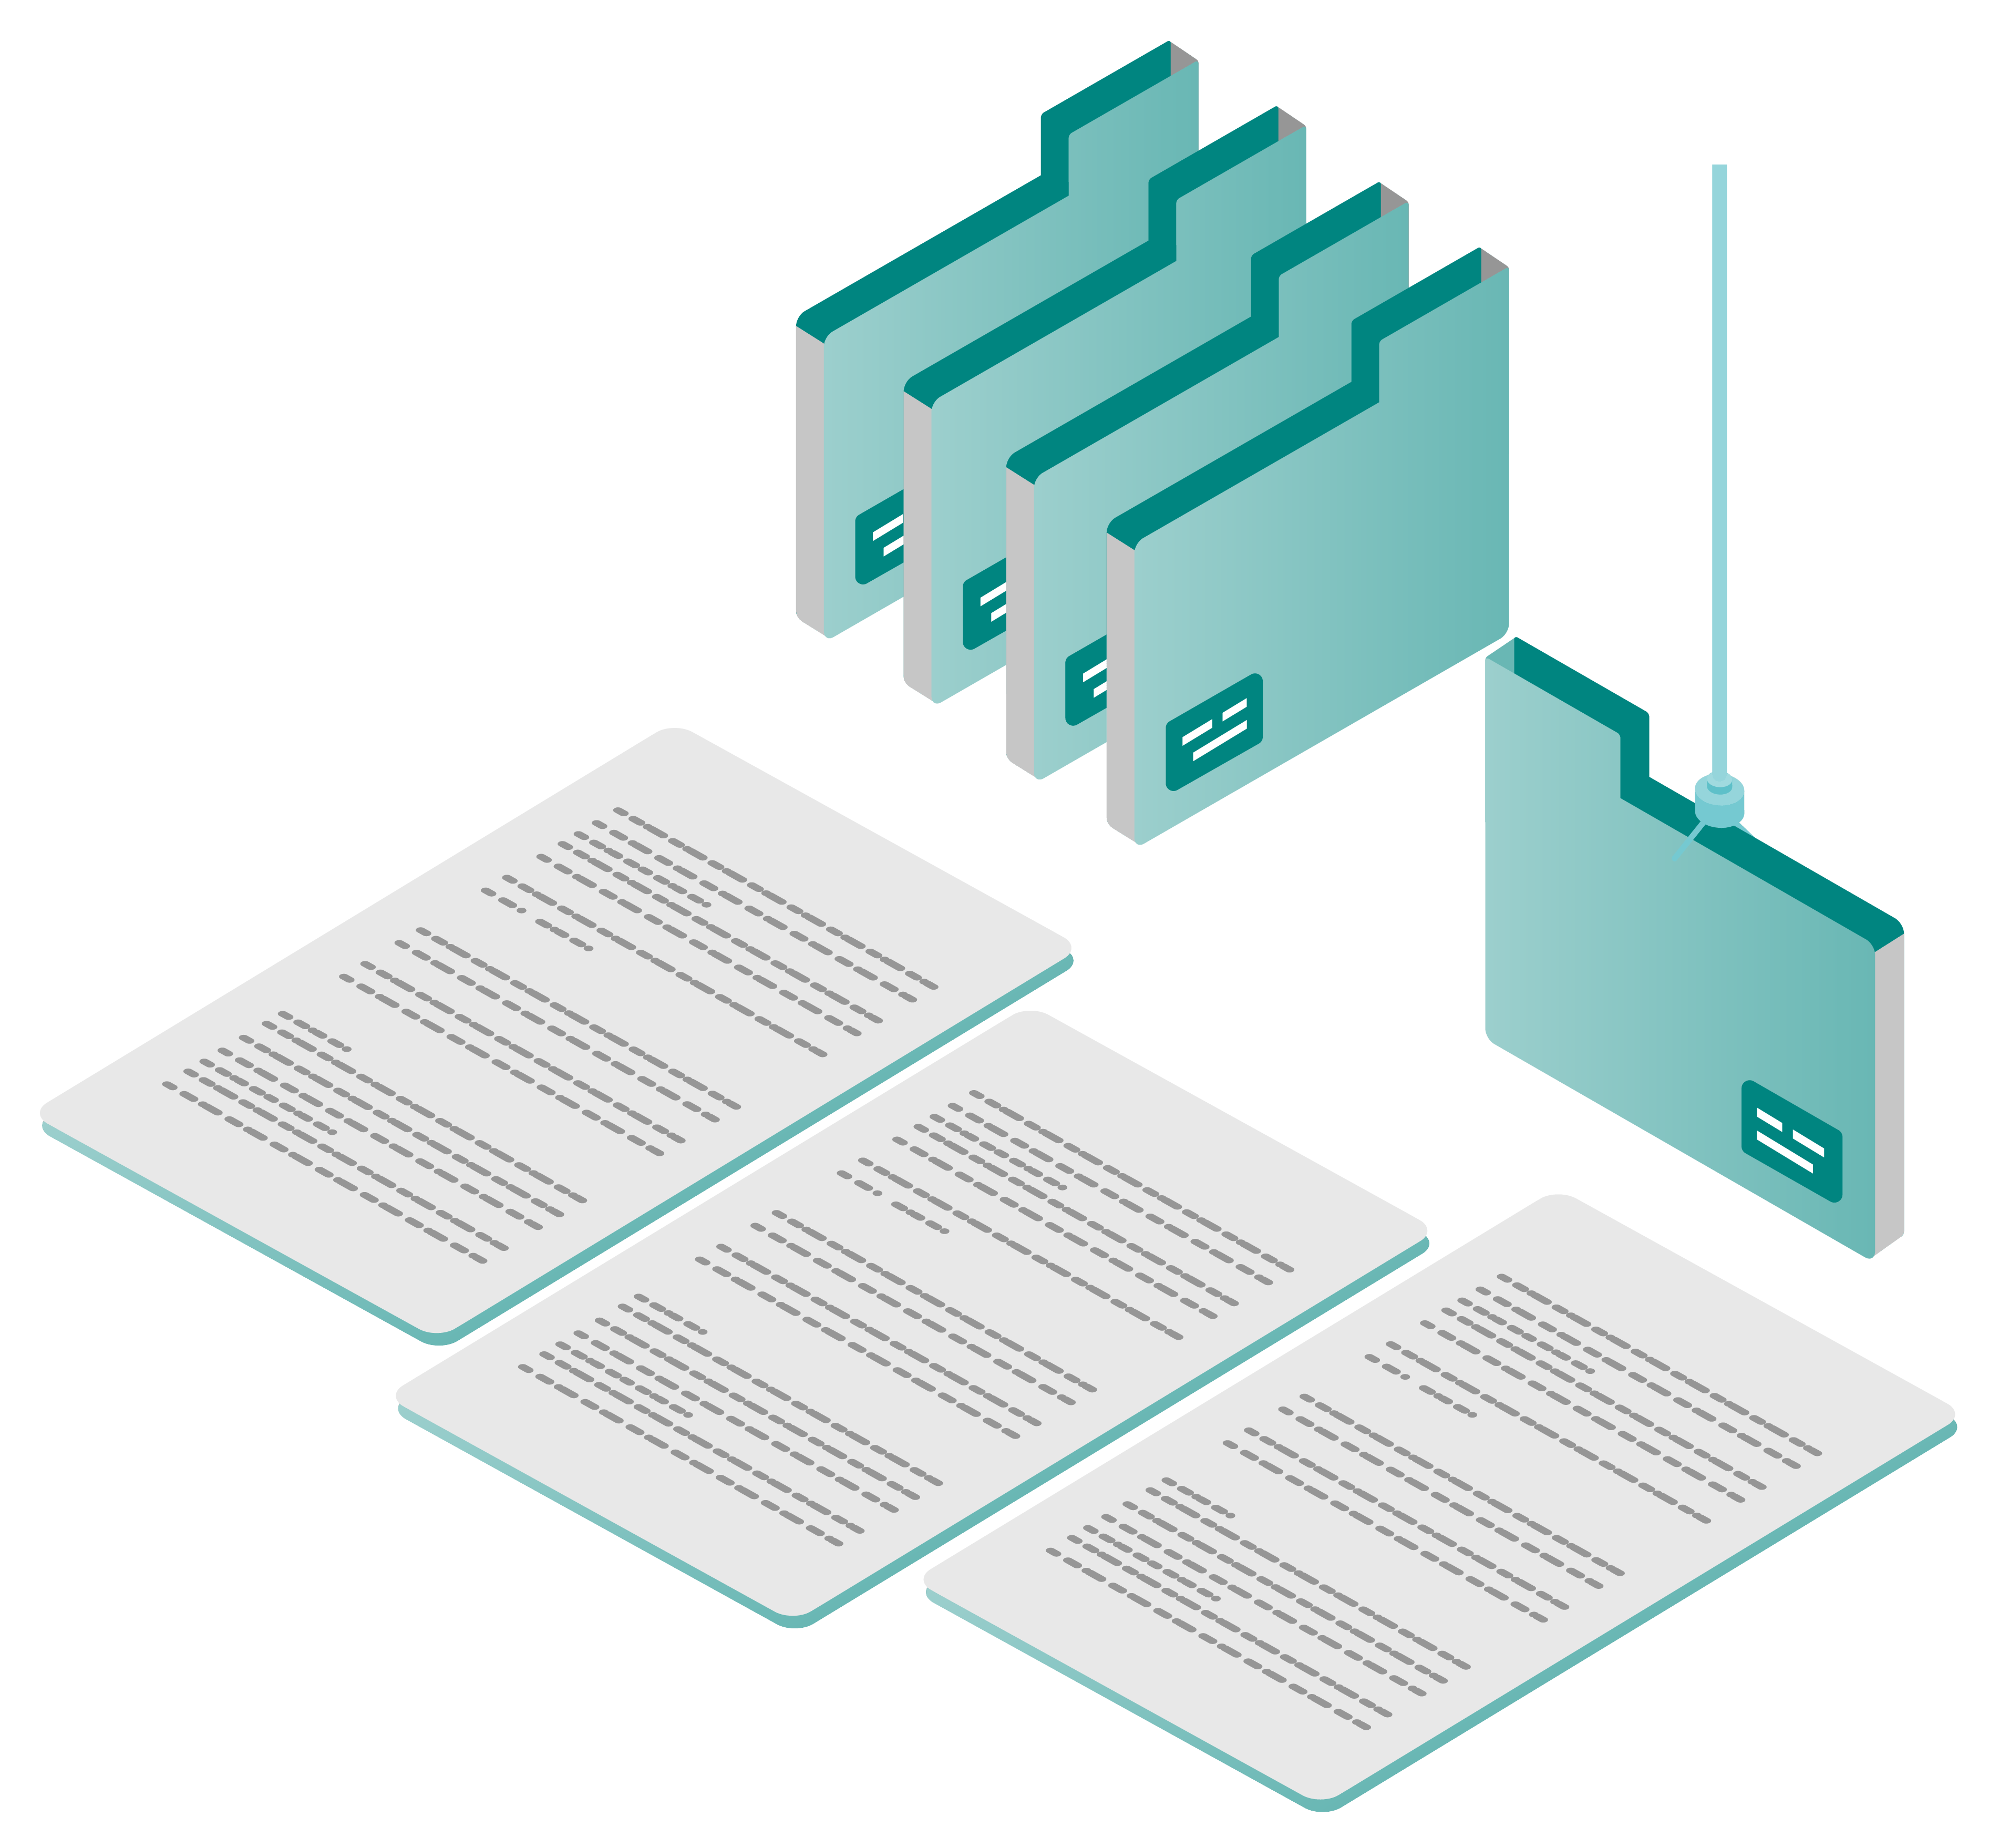
To ensure ease of access, it is important to digitize conflict incident reports. This is done in a systematic way by categorizing them according to the six (6) main causes of conflict namely shadow economies, common crimes, and issues on politics, identity, resource, and governance. To ensure the quality of the processed data, these six main categories are even further fleshed out into 56 subcategories. By doing this, it also becomes easier for search facilities to filter out duplicate items for a smoother process.
Data Validation
Now that the data is sorted and encoded, it is time to validate and understand the conflict better through the help of multi-stakeholder validation groups, who provide depth to the data and add information from the report incidents not covered by the police or media.
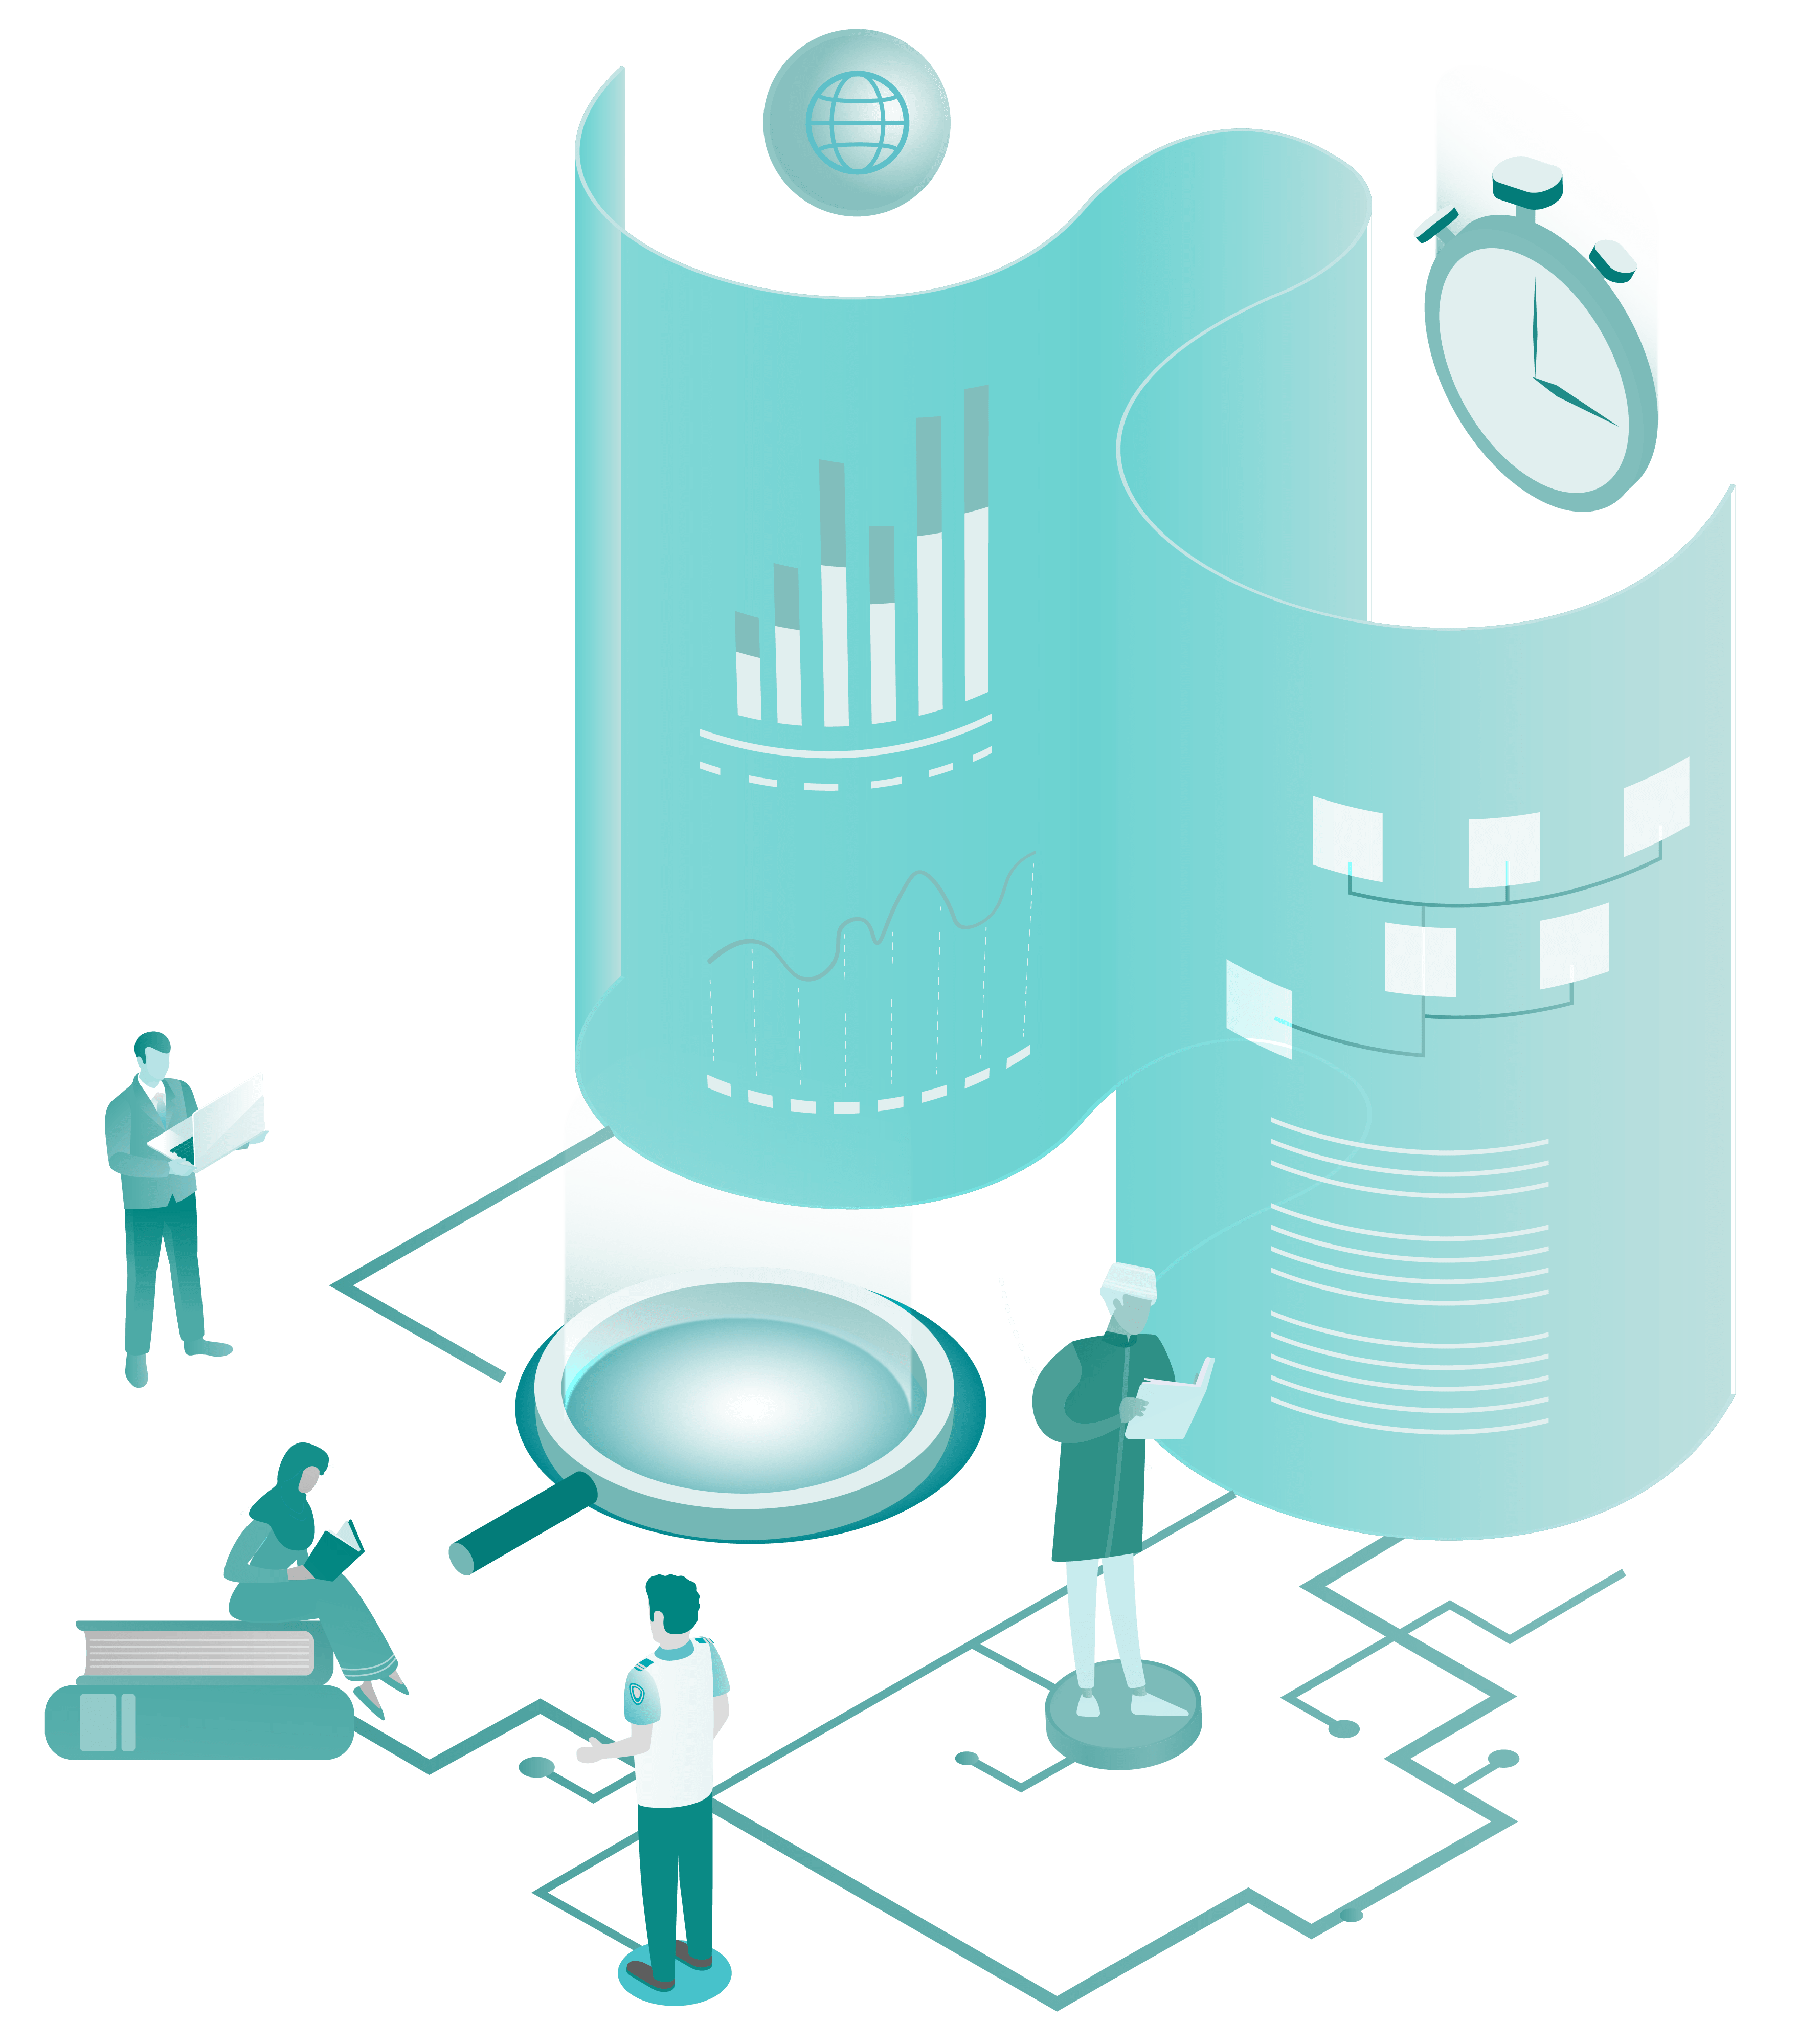
Multi-stakeholder validation groups are composed of people who are experts in investigative journalism, peace building, conflict research, crime monitoring, local governance, policy formulation, and grassroot knowledge. These groups help us deepen our understanding of the conflict incident by using their unique perspectives in identifying the causes of undetermined incidents, providing more details and context, and identifying related incidents and conflict strings.
Data Analysis & Visualization
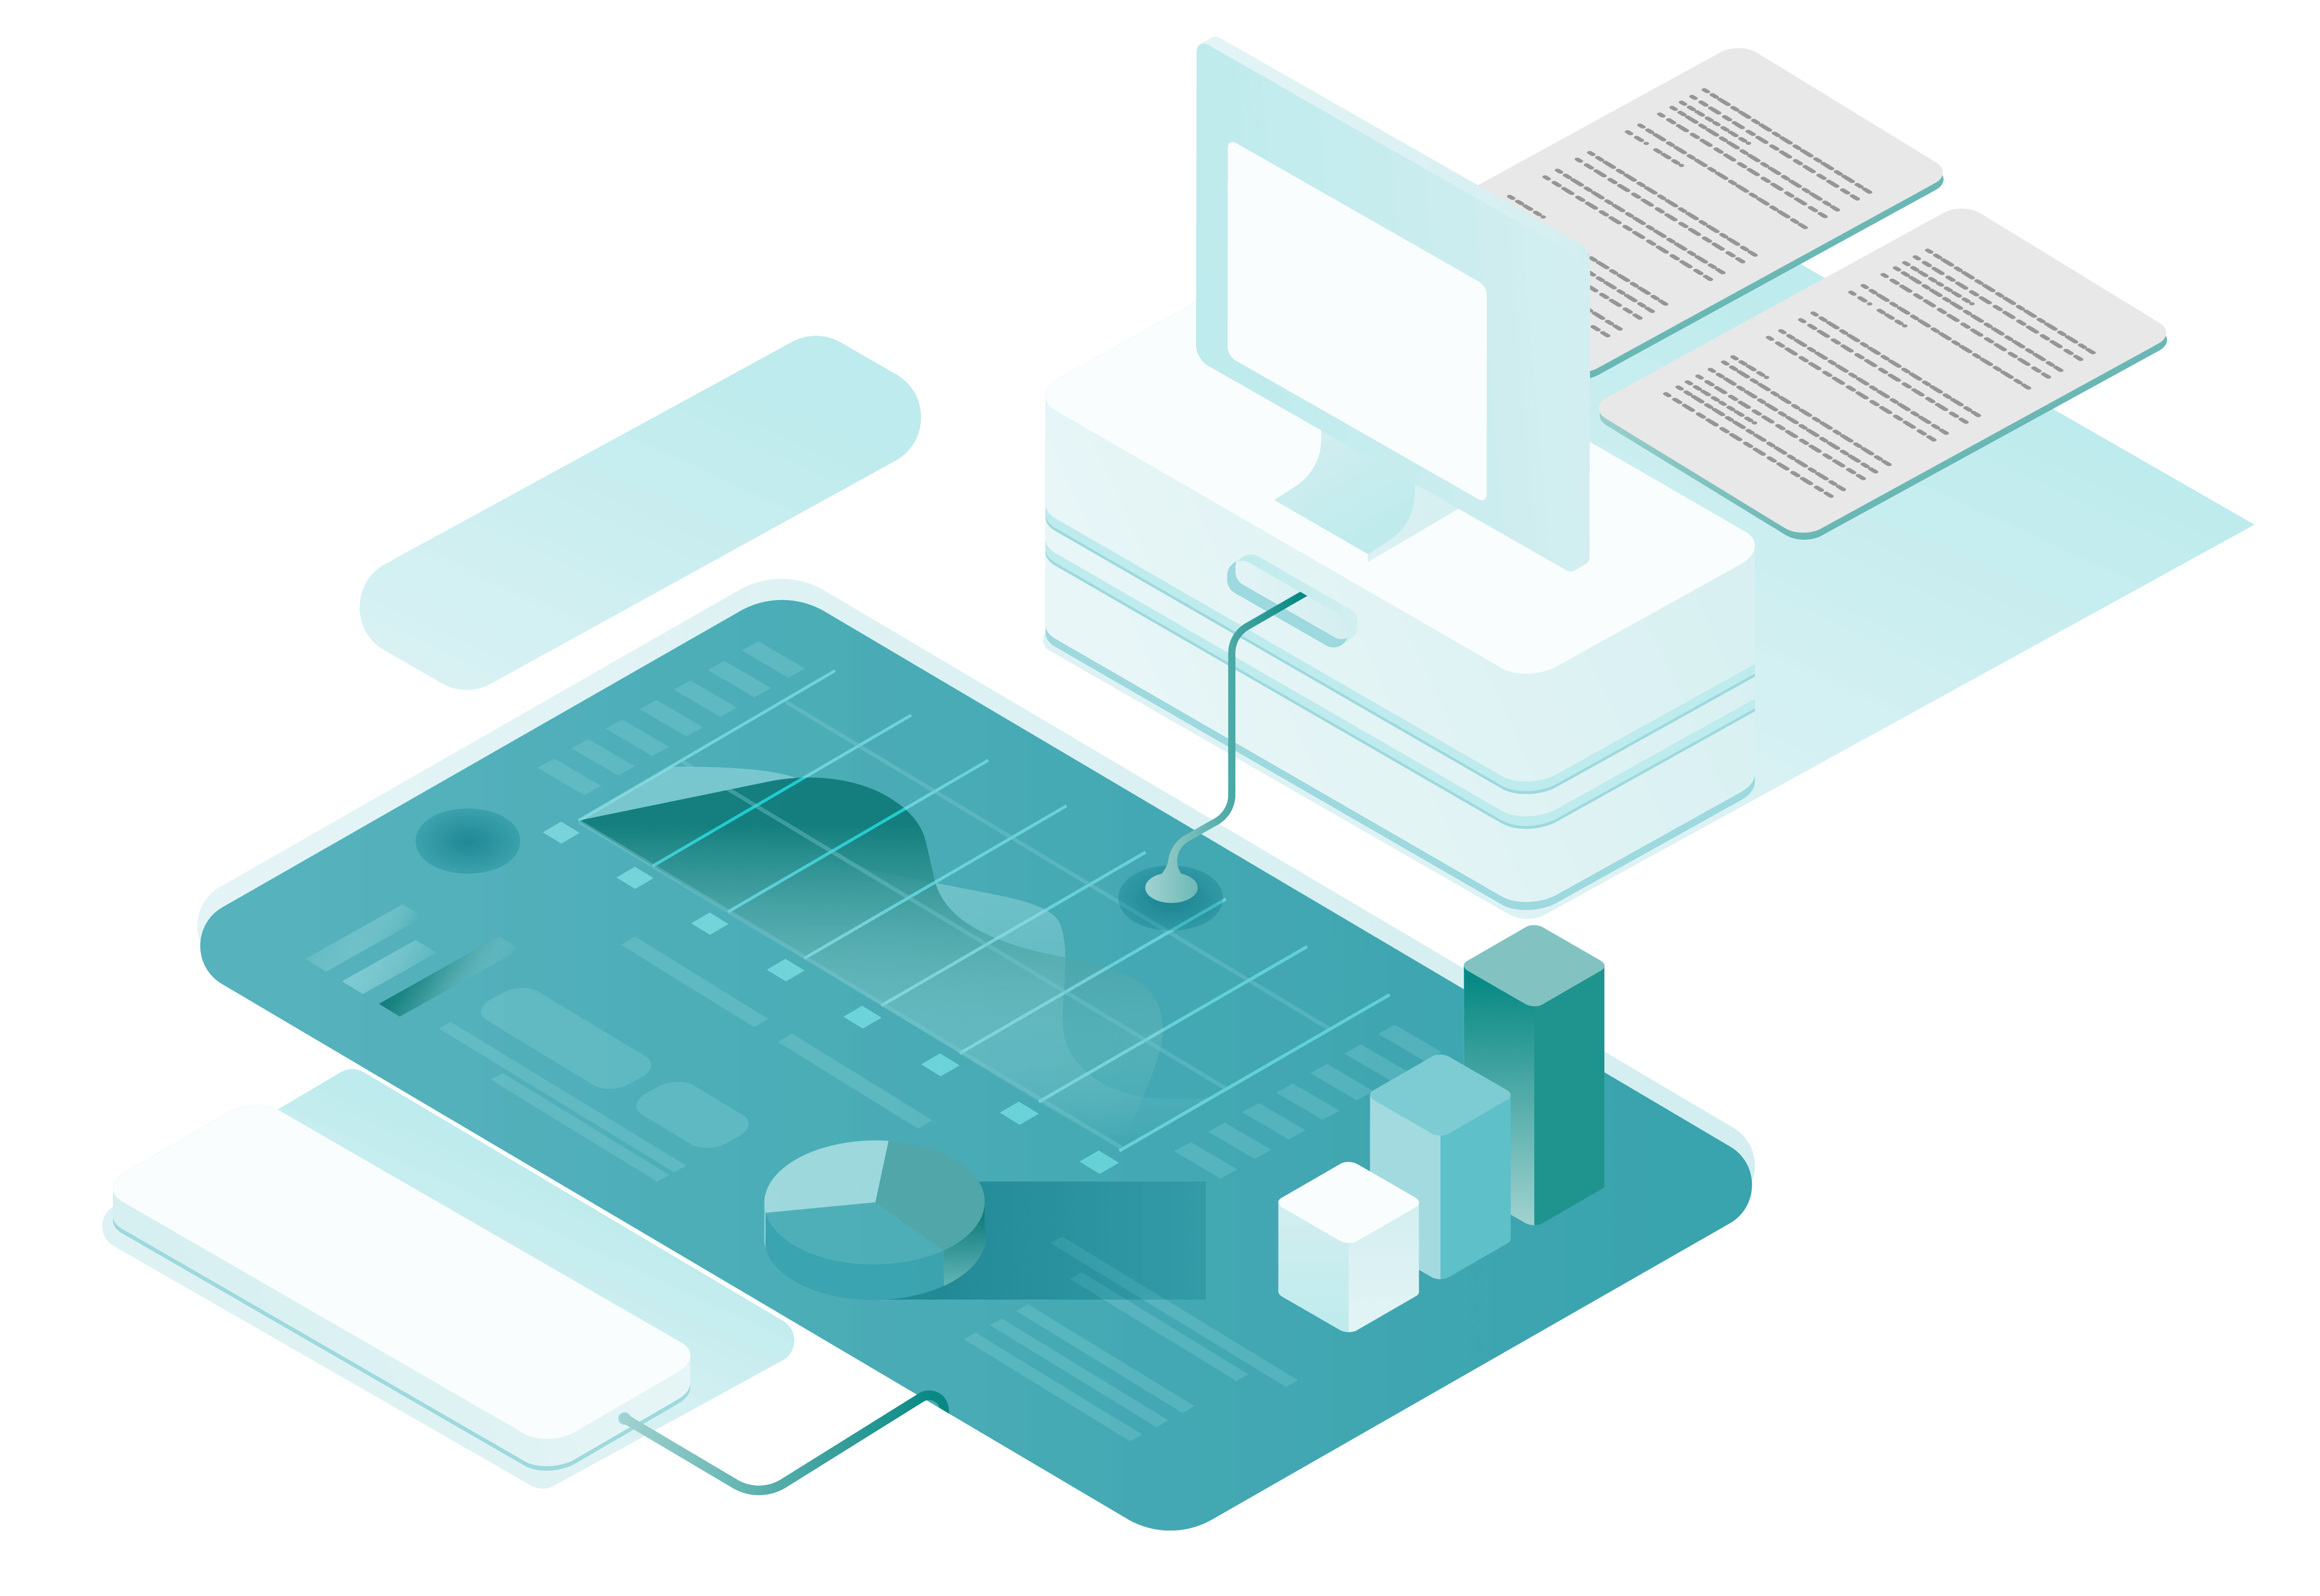
Since the data has been validated, analysis and visualization should be done to better understand the information. In this phase, trends and conflict strings are derived which are then used to create charts, graphs, and other visual models.
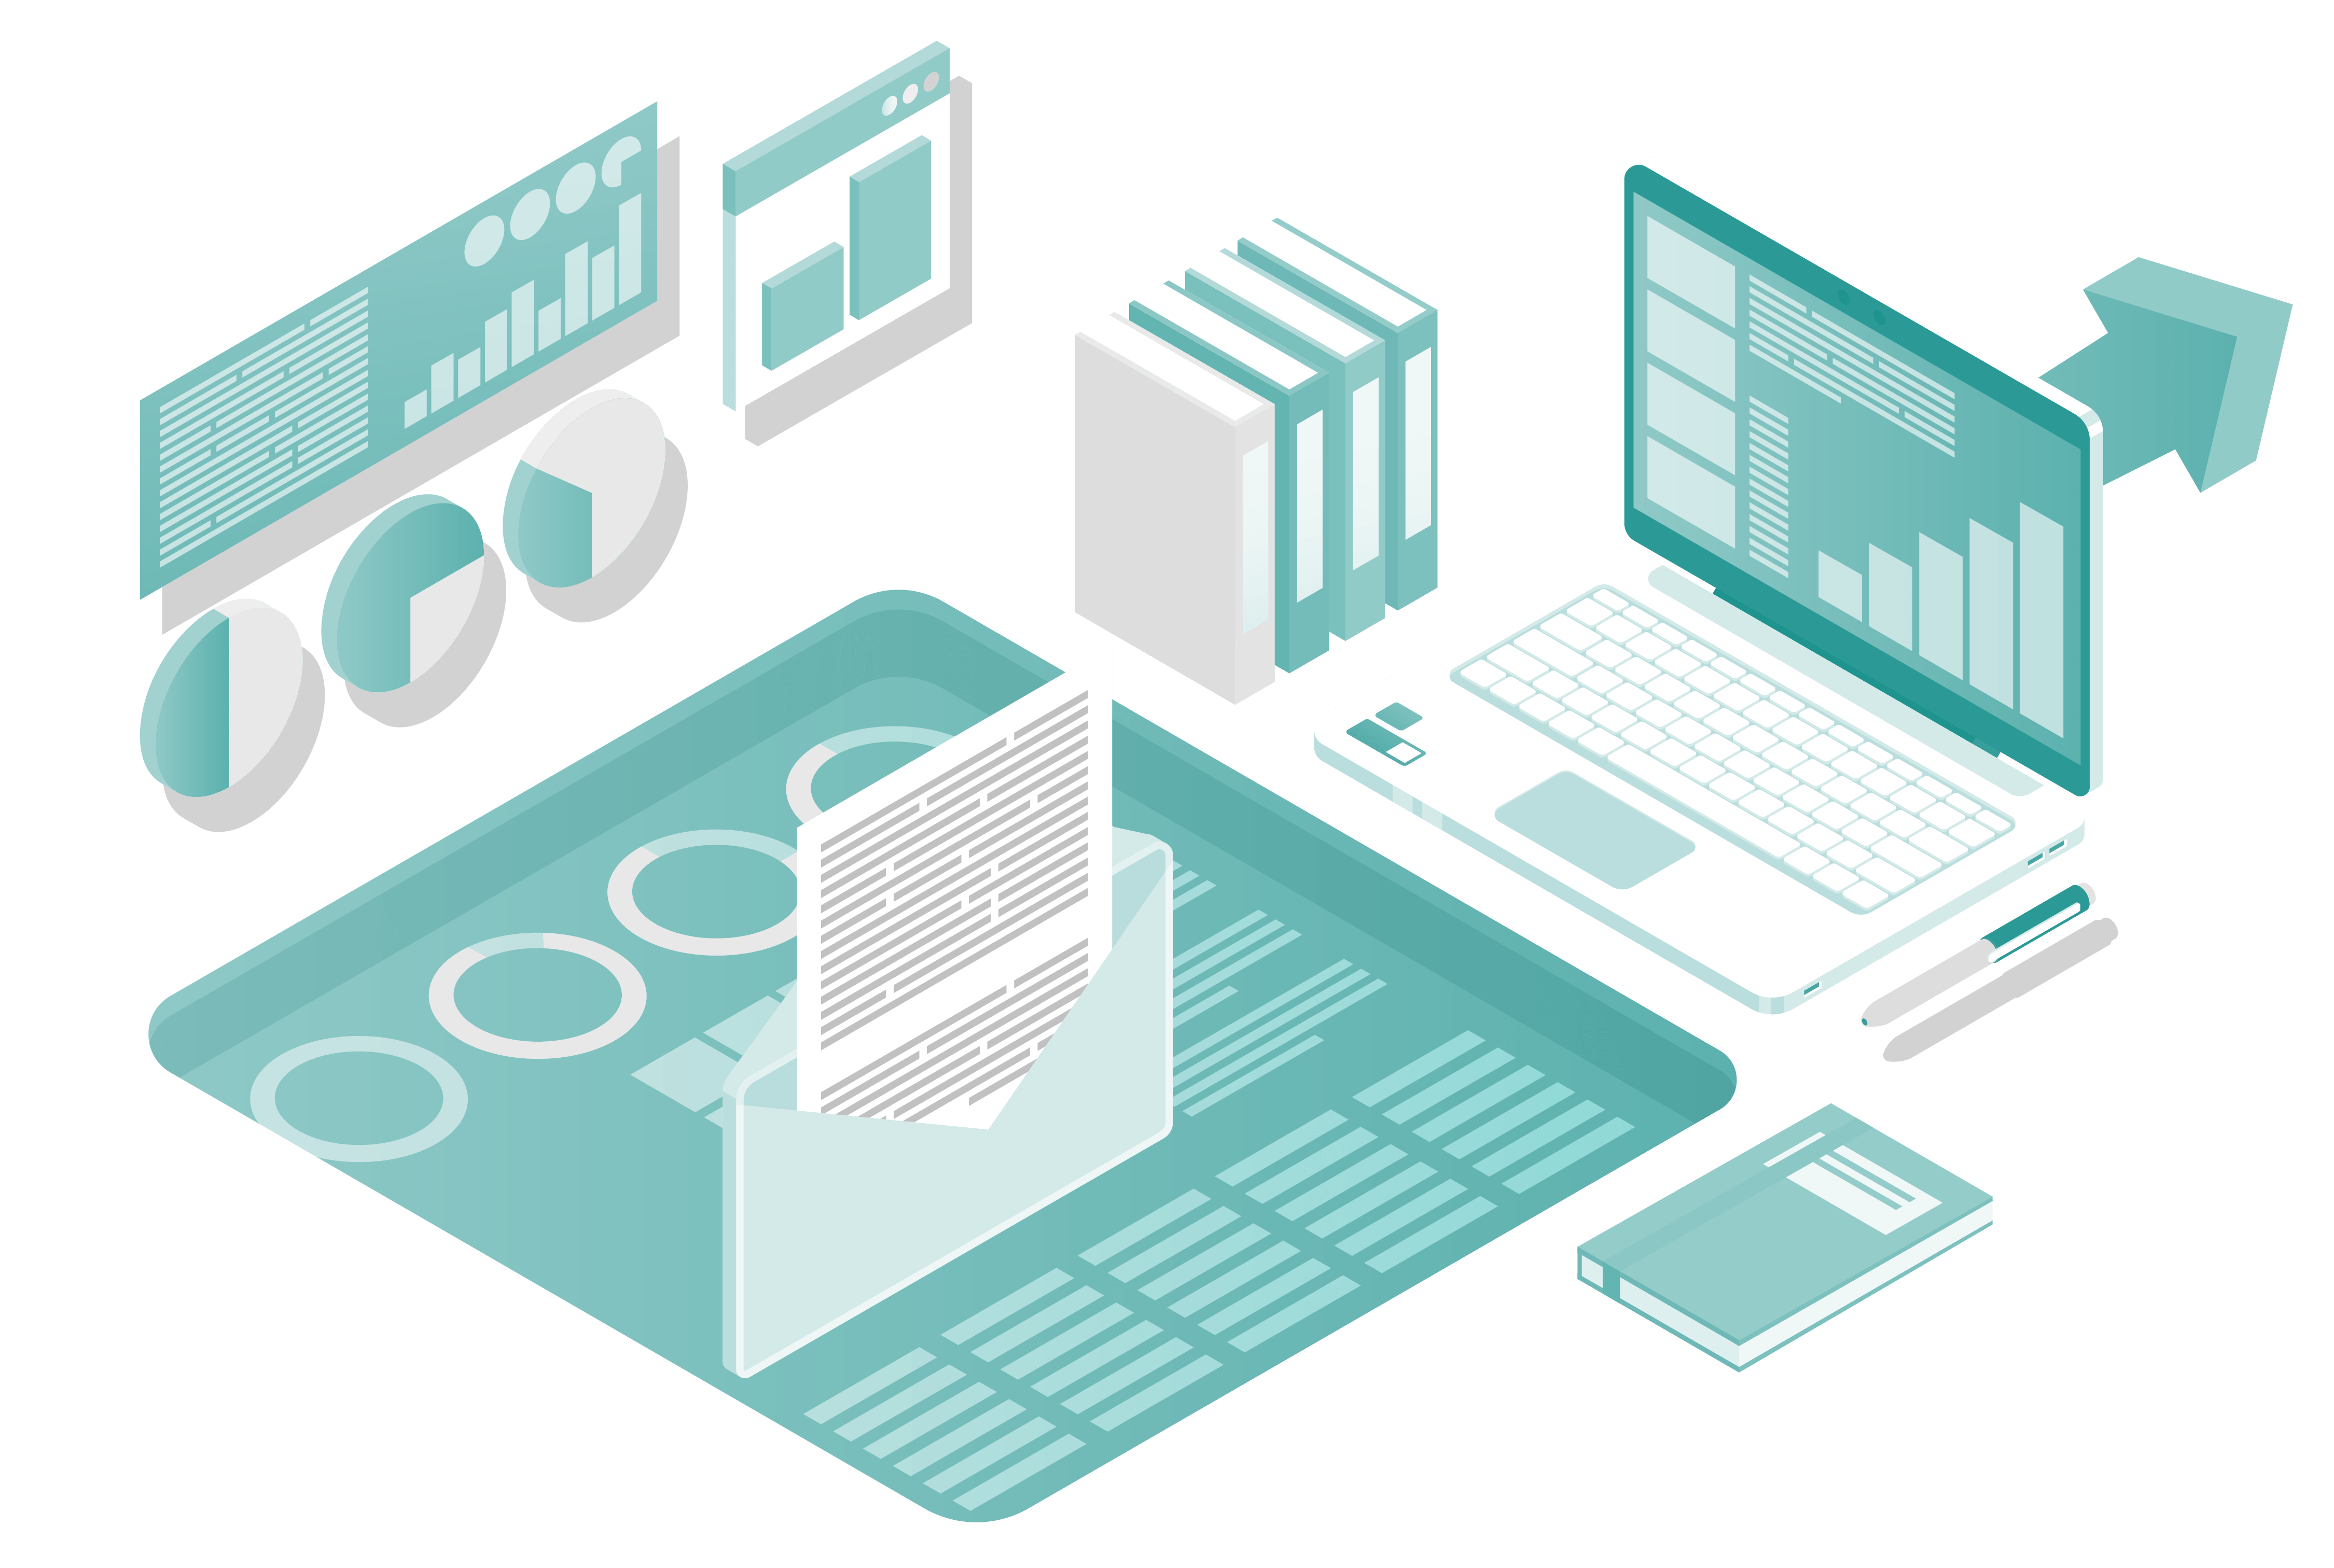
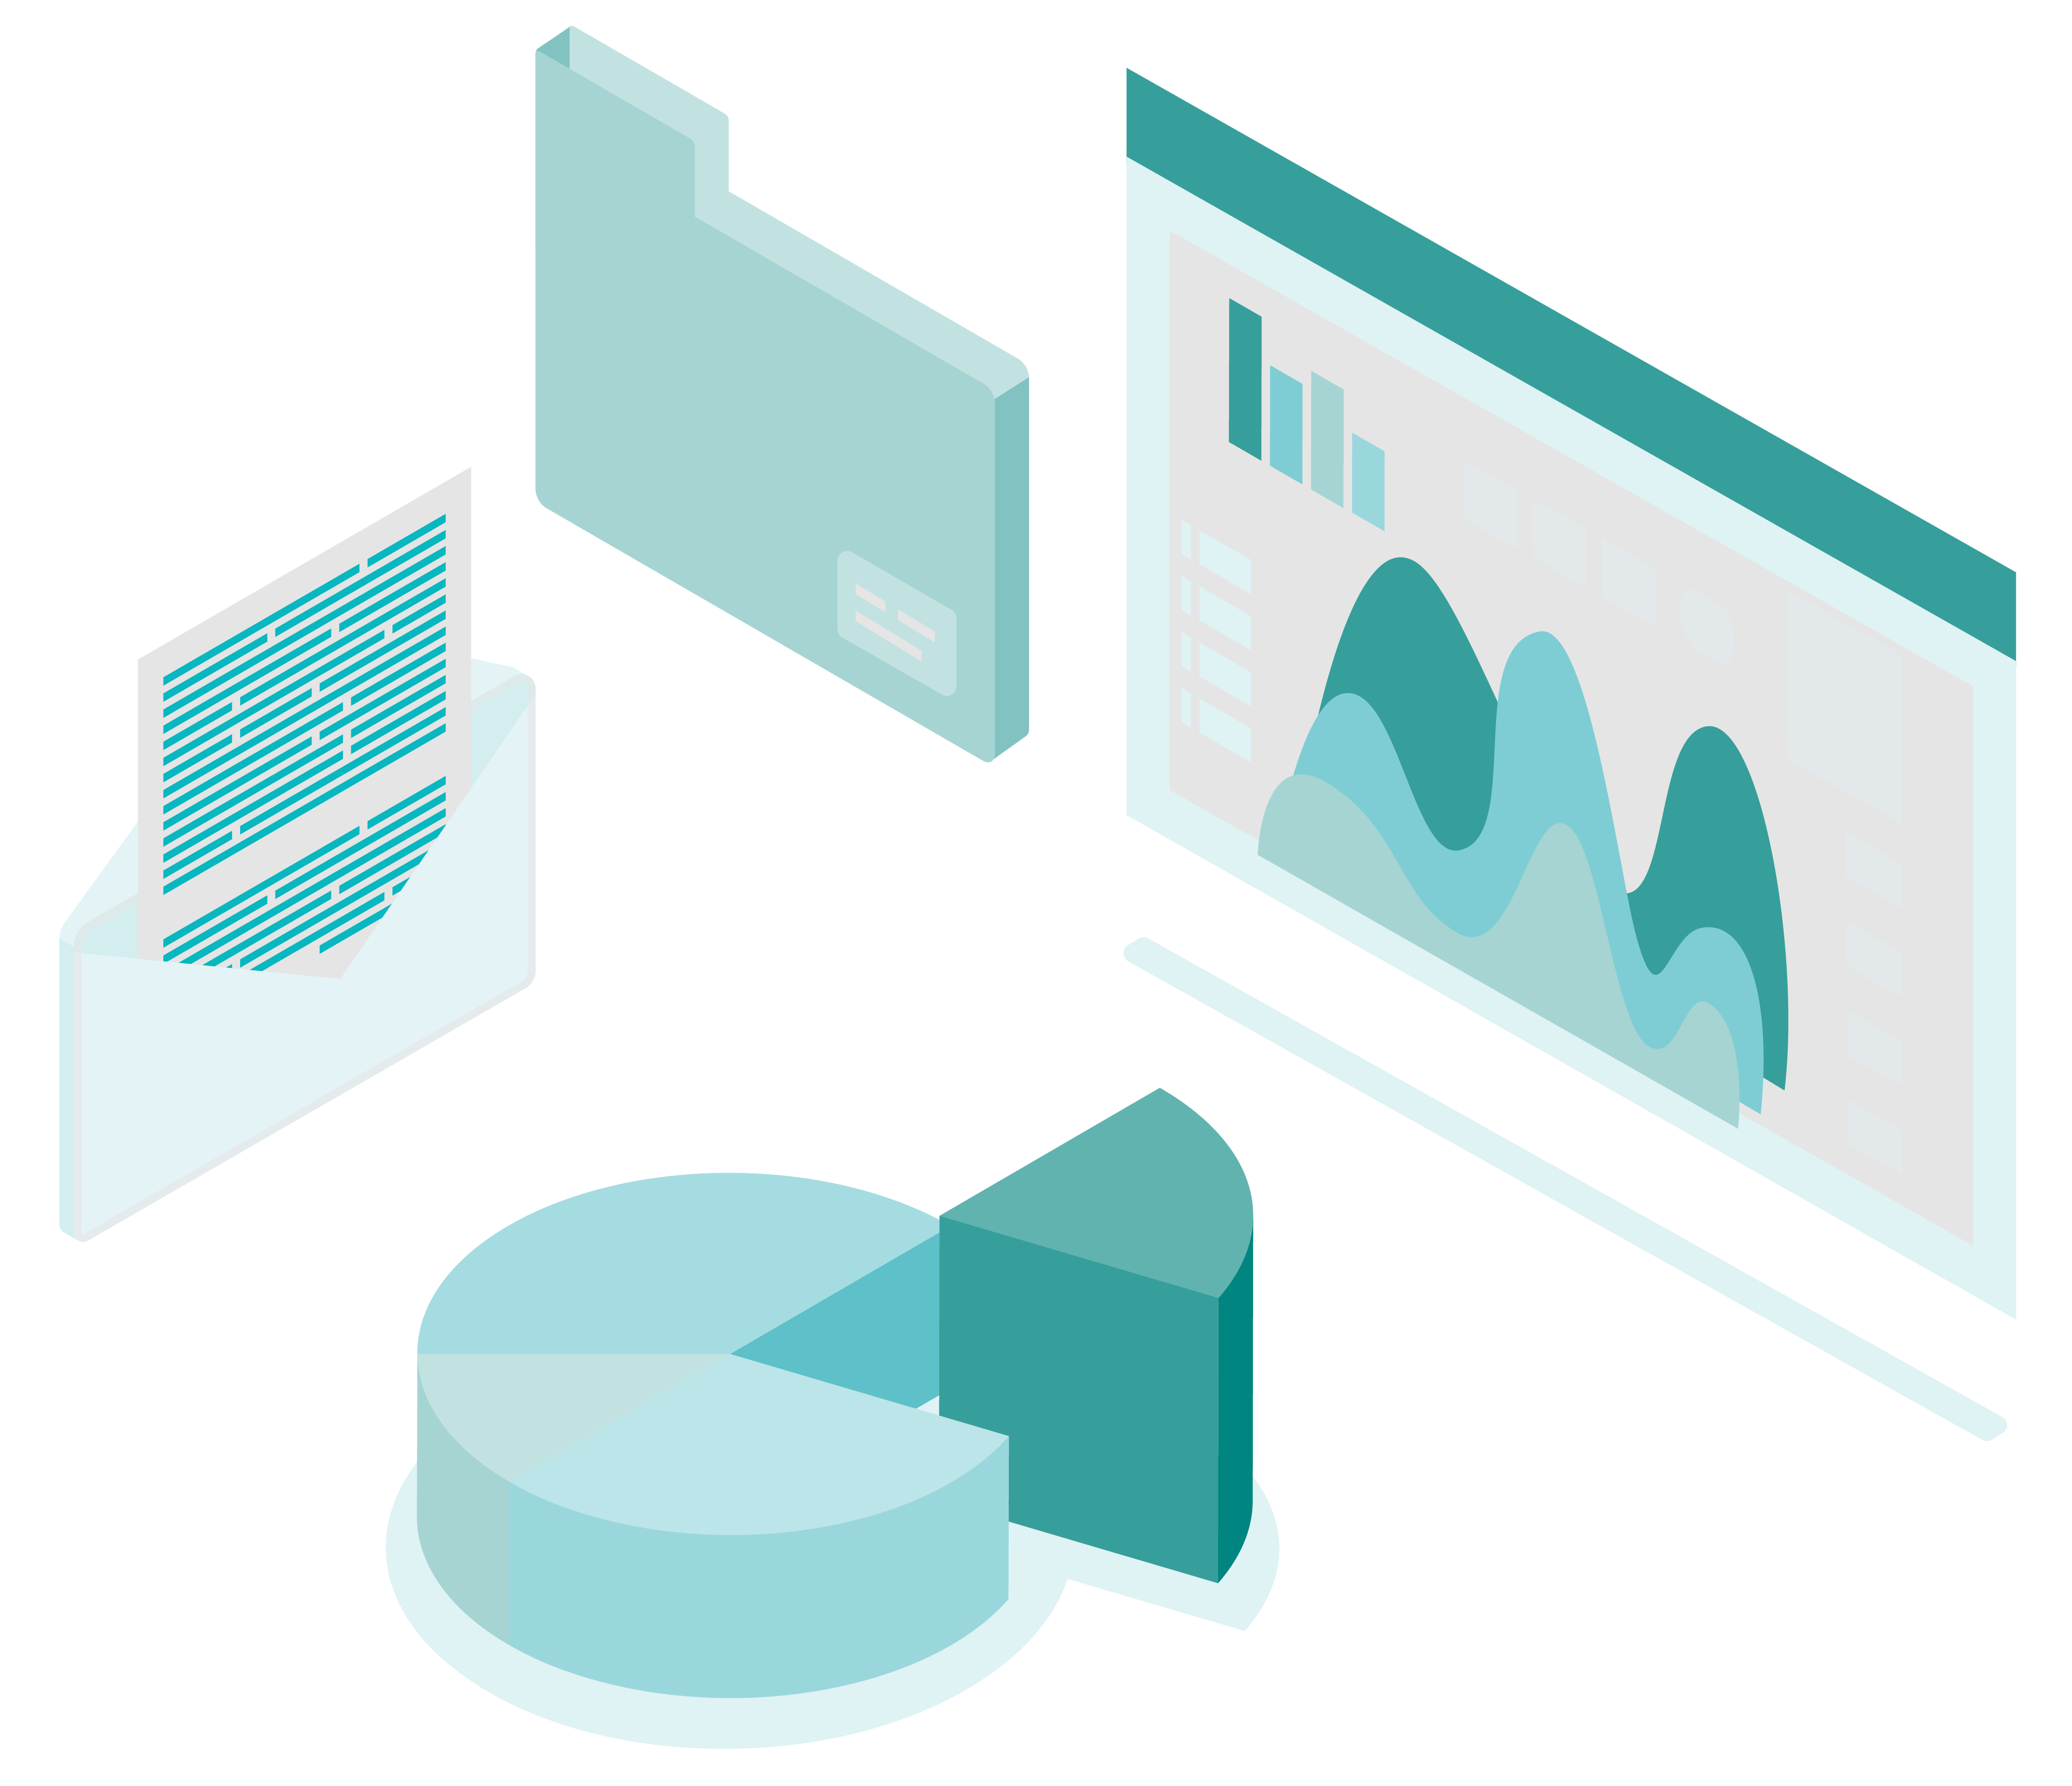
Tabulating data and synthesizing analysis is a crucial part of our methodology. With this, conflict incidents are broken down to their root causes, societal effects, economic impact, and other relevant factors . By presenting the unbiased data in a more accessible, accurate and visual format, it becomes easier for stakeholders to see the picture of how conflicts emerged or morphed into other conflicts, and more importantly, how they can be resolved and prevented.
Data Dissemination
Finally, we upload and store the robust data on our website, ready for everyone’s access. This data is interoperable with a number of software, statistical models and other datasets which means it can be used by government agencies, private firms, etc.
A year’s worth of data is also launched as a much-anticipated annual report, along with its accessible CSV format. This highlights all the learnings we have made and its implications on conflict, development, and peacebuilding. Government agencies, private firms, researchers, and other stakeholders may use data programs such as STATA and SPSS to interpret the data.
